- Info@apostrophe.com.tr
- Turkey Branch: 444 8 231
- Saudi Arabia Branch: +966 56 691 7299

How does the SAT score predict your income
The research is clear and concise: SAT score (and scores on general IQ tests) are strongly connected with student achievement in college and beyond. For some people, this is basic knowledge; for others, it is an uncomfortably painful truth.
Given that it only takes a few hours to administer, the SAT does predict success in college—not perfectly, but fairly well. It can also be graded objectively, unlike a “complex portrait” of a student’s life. (Psychologist John D. Mayer of the University of New Hampshire reportedly called the SAT’s validity a “astonishing success” in a New York Times op-ed.) Paul Sackett, Nathan Kuncel, and their colleagues from the University of Minnesota examined the correlation between SAT scores and college grades in a study that was published in Psychological Science.
The sample size for the study was very large: nearly 150,000 students from 110 colleges and universities. About as well as high school grades, Similar to how high school grades predicted first-year college GPA, SAT score did as well. The best prediction was made by taking into account both factors.
The authors continue by pointing out that the SAT’s predictive validity extends beyond first-year grades and may also be used to predict a student’s four-year total GPA:

Researchers at Michigan State University led by Neal Schmitt discovered that test results—SAT or ACT, depending on the student—strongly connected with total GPA at the end of the fourth year in a four-year study that began with roughly 3,000 college students.
That’s not all, though. SAT results also indicate a student’s likelihood of graduating from college. The GRE, the SAT’s graduate-school equivalent, has a comparable predictive role for success in graduate school, according to Hambrick and Chambris:
A student who scored in the 95th percentile on the SAT or ACT was nearly 60% more likely to graduate than a student who scored in the 50th percentile, according to test results. The Graduate Record Examinations, the Law School Admissions Test, and the Graduate Management Admission Test are the SAT’s graduate school equivalents, and all three have equally strong supporting data. “Standardized admissions tests have favorable and helpful associations with later student accomplishments,” stated a Science article from 2007 that clearly summarized the facts.
Perhaps more importantly, SAT score predict success outside of an academic setting. Top performers are more likely to belong to the highest earning percentage:
Even success after graduating from college is predicted by SAT scores. Researchers David Lubinski, Camilla Benbow, and their colleagues at Vanderbilt University have been following the successes of individuals who, as part of a childhood talent hunt, scored in the top 1 percent on the SAT by age 13, for more than 20 years.
Surprisingly, even among this group of talented students, those who scored higher were more likely to not only obtain further degrees but also to be successful outside of the classroom. The exceptionally gifted, for instance, were more than twice as likely as adults to earn an annual salary in the top 5 percent of Americans as compared to those who “only” scored in the top 1 percent.

In attempt to level the playing field for high school students from a wider range of families, the College Board announced on Wednesday that it is redesigning the SAT, eliminating the timed essay, and placing less emphasis on fancy language.
According to the organization’s own data, wealthy Americans and families with higher levels of education typically perform much better on the best. As do students who had the chance to take the PSAT in high school before taking the SAT, as well as white and Asian Americans.
These four conclusions almost definitely share a common genesis in the fact that the SAT rewards families that can give their children a better education and greater test preparation. But these four graphs (chick the link to see the graphs) demonstrate how the SAT score benefits particular groups of people.
The first graph demonstrates the strong relationship between SAT score and income. The average combined score for students from households making more than $200k per year is 1,714, whereas the average combined score for students from families making less than $20,000 per year is 1,326. The essay is being eliminated by College Board authorities because the writing test has the biggest score disparity.
The second graph demonstrates the academic success of students from educated homes. For instance, a youngster who has a parent with a doctorate degree often achieves SAT scores 300 points higher than a student who merely has a high school diploma. Given that there are significant returns to a college education, there is no doubt that this dynamic is reflected in the income graph. The idea that kids in America have strong prospects to advance regardless of the family they were born into is also refuted by this.
The third graph demonstrates that whites and Asians score significantly higher than other ethnic groupings. African Americans score the lowest on the test, with an average of 1,278 while Asians score the highest, with an average of 1,645. It appears that the advantage of white students over black and Hispanic students is roughly similar for the reading, math and writing test.
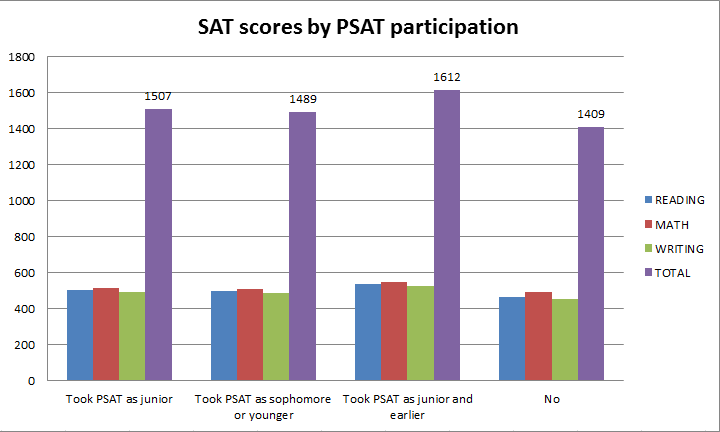
The fourth chart shows that taking the PSAT once or twice tends to lead to a higher score. Students who don’t take the PSAT, for instance, have an average score of 1,409, while students who take it twice – once in their junior year and then once before that — have an average score of 1,612. This almost certainly reflects the fact that schools in wealthier communities do a better job of preparing students for standardized testing, including by offering PSATs.
However what if we talk about different thing: why wealthy students perform better on the SAT score.
The average combined score for kids from households making more than $200,000 per year was 1,714, while the average combined score for students from families making less than $20,000 per year was 1,326.
According to a 2015 survey by Inside Higher Ed, students from families earning less than $20,000 had the lowest average SAT scores in each of the three sections (reading, writing, language, and math), while those earning more than $200,000 had the highest averages.
According to Inside Higher Ed, the reading section showed the biggest disparities. Students with family incomes under $20,000 received an average score of 433 while those with family incomes over $200,000 received an average score of 570.
Wealth affects more than just SAT score. Born to Win, Schooled to Lose” is a new report from the Georgetown Center for Education and the Workforce that asserts that wealth at birth is a greater predictor of adult success in the United States than academic achievement. Anthony P. Carnevale, the report’s principal author, told CNBC Make It that it is preferable to be born wealthy than educated in order to succeed in America.

Here’s why rich students perform better on the SAT (SAT score):
Cost
Richer students typically score higher on the SAT because they can afford to take the exam multiple times, which has been shown to raise a student’s score.
The SAT was around $47.50 for the basic test and $64.50 for the comprehensive essay test during the 2018–2019 academic year. Students must pay a $26 registration fee, $22 for each additional test, and $26 for each language exam in order to take a SAT score test.
Many students may find these expenses to be unaffordable. A large number of low-income students are eligible for fee waivers that include two free SATs, with or without the essay, and six free SAT subject exams. However, wealthier students are still more likely to have taken many SATs, for example.
Academic guidance
Richer school districts often have better-funded schools for their students to attend. Due to these financing differences, wealthier children are more likely to attend high schools that will provide them an advantage when applying to colleges and completing standardized tests.
Rich children are more likely to attend high schools with a high concentration of AP programs, to have access to tutors, and to have taken test preparation classes – all benefits that have been linked to higher SAT score.
More time
In comparison to their counterparts from lower-income homes, students from high-income families are also more likely to receive extra time on standardized tests.
According to a Wall Street Journal analysis of data from 9,000 public schools, students in wealthy communities are more likely to receive special “504 designations,” which are usually given to students with anxiety or ADHD and permit specialized academic accommodations like extra time or a private space when taking exams of all kinds, including the SAT.
Singer himself recommended families to use it because it is so beneficial.
The question of whether universities should take standardized test scores into account when making admissions decisions has drawn more and more attention in recent years. The University of California system had recently declared that it will no longer take SAT score or ACT results into account when making scholarship or admissions choices. Colorado has approved a law stating that candidates cannot be asked to submit their results from national assessment tests. Many institutions eliminated these tests as prerequisites for admission as a result of the lack of testing during the coronavirus pandemic.
Using information from the National Longitudinal Survey of Youth 1997 (NLSY97), a sample of the cohort of students aged 12- to 17 in 1997, we can see that there are numerous other measures that may be used to determine each student’s aptitude in addition to household income. The SAT and ACT are the first set of metrics, which we refer to as national measures since they are uniform for all test-takers and are frequently utilized for college admissions. We look at the math and verbal SAT score test for students. Additionally, we look at the composite score of individuals who take the ACT.
The second set of metrics, grade point average (GPA) and class rank, which we refer to as school-specific measures since they are standardized individually for each high school, show how each student performs in comparison to their peers. We track each student’s cumulative high school grade point average (GPA) and estimated percentile standing within the graduating class. The last indicator, a test taker’s Armed Services Qualification Test (AFQT) score, is also nationally representative in that it is uniform across all test takers, but it is not utilized in college admissions, reflecting an unobserved student ability signal (with respect to the admissions process).
Income and Student Ability Signals: A Relationship
We can take the correlation between them to ascertain how well signals of student ability reflect variations in household income. A positive correlation between income and an ability metric indicates that students with higher earnings tend to be more towards the top of this ranking SAT score, whilst a negative correlation indicates the opposite. Correlations range from -1 to +1. We start by looking at the relationships between household income, high school GPA, high school rank, SAT score (verbal and math scores), and AFQT score. Table 1 shows the paired results for students who take the SAT.
| Household income | High school GPA | High school rank | SAT score math | SAT score verbal | AFQT exam score | |
| Household income | 1.00 | – | – | – | – | – |
| High school GPA | 0.07 | 1.00 | – | – | – | – |
| High school rank | 0.06 | 0.53 | 1.00 | – | – | – |
| SAT score Math | 0.22 | 0.50 | 0.38 | 1.00 | – | – |
| SAT score verbal | 0.18 | 0.43 | 0.34 | 0.72 | 1.00 | – |
| AFQT score | 0.16 | 0.45 | 0.34 | 0.76 | 0.78 | 1.00 |
The first column shows that there are all positive correlations between student ability measures and household income. In other words, every indicator of a student’s aptitude or performance implicitly captures some variation in their financial situation. However, for school-specific measurements, the severity of income capture is lessened.
SAT score, particularly on the math section, have correlations with household income that are roughly three times as large as high school GPA and class rank, which have weakly positive correlations with household income that range from 0.06 to 0.07. As a result, selection based on national metrics will favor wealthy students more than selection based only on school-specific metrics.
It is commonly known that low-income and high-income students perform differently on standardized tests. In this essay, we explore if and how additional measures of student achievement are related to family income, as well as how this relationship varies depending on whether the measure is used nationally or at a particular school.

The trade-off, however, is that the SAT score does provide additional information beyond high school GPA and class rank. While SAT performance is closely connected to high school GPA (correlations of 0.50 for math and 0.43 for verbal) and class rank (correlations of 0.38 for math and 0.34 for verbal), it is even more closely associated to AFQT performance (correlations of 0.76 and 0.78 for math and verbal, respectively).
For comparison, the relationship between AFQT score and high school GPA is 0.45. As a test designed to gauge cognitive capacity and a tool frequently used in the literature to gauge personal aptitude (Griliches and Mason, 1972; Arcidiacono et al., 2010; Agarwal and Mazumder, 2013), The SATs significantly outperform school-specific measures at capturing variations in AFQT performance.
They repeat this procedure using ACT scores in place of SAT score. Table 2 lists the pairwise relationships among ACT-taking students. Again, school-specific indicators have a less severe impact on how much wealth is represented by rankings of student performance. About 2.3 times as much of a positive link exists between the ACT composite score and household income as there is between high school GPA and class rank. However, just like the SAT, the ACT gauges student aptitude to a degree that would be missed if only school-specific metrics were used.
Over and above the AFQT’s still strongly positive correlations with high school GPA (0.55) and class rank, students’ composite ACT scores have a very substantial association (0.82) with unobserved ability as judged by test results (0.52). Standardized tests not only reflect students’ environments outside of the classroom, in this case household income, but also some student ability not captured by school-specific measures.
| Household income | High school GPA | High school rank | ACT composite score | AFQT exam score | |
| Household income | 1.00 | – | – | – | – |
| High school GPA | 0.09 | 1.00 | – | – | – |
| High school rank | 0.10 | 0.76 | 1.00 | – | – |
| ACT composite score | 0.23 | 0.59 | 0.55 | 1.00 | – |
| AFQT score | 0.21 | 0.55 | 0.52 | 0.82 | 1.00 |
Parents’ education consistently has a larger correlation with SAT results than parents’ income, and regression with good adjustments for race, education, and other variables typically suppresses the income variable to insignificance. Due to the fact that so few parents had less than a high school diploma, education could no longer be effectively controlled, and parents’ income became a proxy for parents’ education, the income variable became significant when the education threshold was reached.
Given the high heritability estimates from twin studies for high-stakes standardized exams in the UK and the Netherlands, some of this dominance may be due to genetics in test performance related to parents’ educational attainment.
